Summary
Order books look transparent, yet a good part of real trading intent never shows up on them. For example, say a fund wants 400 BTC. A single bid that size invites everyone watching the ladder to step in front, so the order gets chopped up and masked or spread across venues. Spotting that hidden size helps explain why some levels hold while sellers keep hitting them.
A standard depth ladder shows the book only as it looks right now — a quiet reload is easy to miss. Where the ladder in most trading software gives a snapshot, the ATAS heatmap plots resting liquidity over time as a color-coded map so that levels that keep returning after trades stand out. Those repeated reloads are often the first visible trace of an iceberg order.
 How Iceberg Orders Work
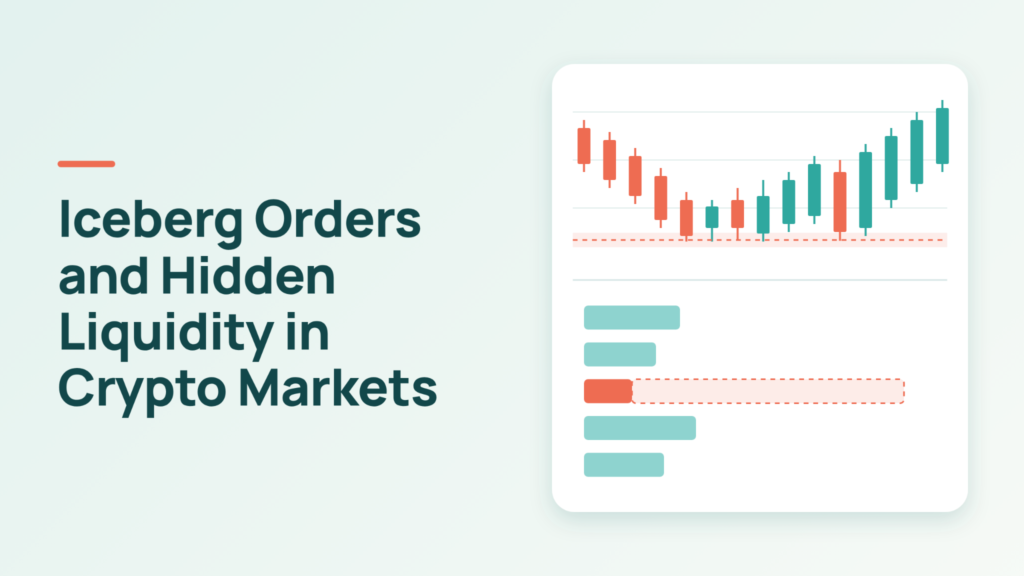
An iceberg order is a limit order with two quantities: a displayed peak and a hidden reserve. The book shows only the peak. Once that fills, a fresh slice appears at the same price, then another, until the full size has traded or the order is canceled.
The motive is cost control. A visible 400 BTC bid invites others to move ahead of it, which worsens the average fill price. Several large crypto exchanges offer this order type natively, and traders can reproduce the effect with their own bots.
The trade-off has been measured in equities. One study of hidden orders in Euronext Paris stocks found that concealed orders cost less to implement, yet were less likely to execute completely and took longer to finish. Crypto markets differ, but the incentives are similar.
Warning Signs in the Tape and Order Book
A single sign proves nothing, so it helps to wait until several line up. The usual candidates:
How Iceberg Orders Work
An iceberg order is a limit order with two quantities: a displayed peak and a hidden reserve. The book shows only the peak. Once that fills, a fresh slice appears at the same price, then another, until the full size has traded or the order is canceled.
The motive is cost control. A visible 400 BTC bid invites others to move ahead of it, which worsens the average fill price. Several large crypto exchanges offer this order type natively, and traders can reproduce the effect with their own bots.
The trade-off has been measured in equities. One study of hidden orders in Euronext Paris stocks found that concealed orders cost less to implement, yet were less likely to execute completely and took longer to finish. Crypto markets differ, but the incentives are similar.
Warning Signs in the Tape and Order Book
A single sign proves nothing, so it helps to wait until several line up. The usual candidates:
- Repeated refills: The visible size gets hit, then comes back at the same quantity and price, sometimes a dozen times running.
- Volume above displayed size: Executed volume at one level far exceeds the largest quantity ever shown there.
- Absorption: Aggressive market orders hit the level, and the price hardly budges.
- Uniform prints: Trades of nearly the same size appear on the tape at steady intervals, which often means an algorithm is feeding in slices.
Take a hypothetical bid at a round number with 5 BTC showing. Over twenty minutes, 90 BTC changes hands at that price, the display snaps back to 5 BTC after every hit, and the price never closes below it. The screen never showed more than 5 BTC, yet most of the buying interest sat unseen until it traded.
Spoofing is easy to mix up with icebergs. A spoofed order displays a large size and pulls it as the price approaches. An iceberg works the other way around: it shows little and keeps absorbing. Confuse the two, and you end up reading support that isn’t there or writing off a level that is soaking up orders.
Which Data View Shows What
Use two or three views together instead of relying on one — each of them can show a different part of the same event. The table below lays out what each contributes.
| Data view | What it shows | What an iceberg can look like |
| Order book ladder | Resting limit orders right now | A small visible size that keeps resetting to the same quantity at one price |
| Time and sales | Executed trades in sequence | Repeated prints at one price whose total exceeds the visible size |
| Footprint chart | Bid and ask volume at each price inside a bar | One price with heavy volume while the bar barely extends |
| Liquidity heatmap | Resting orders over time as color intensity | A level that keeps trading yet stays displayed, or reappears after each hit |
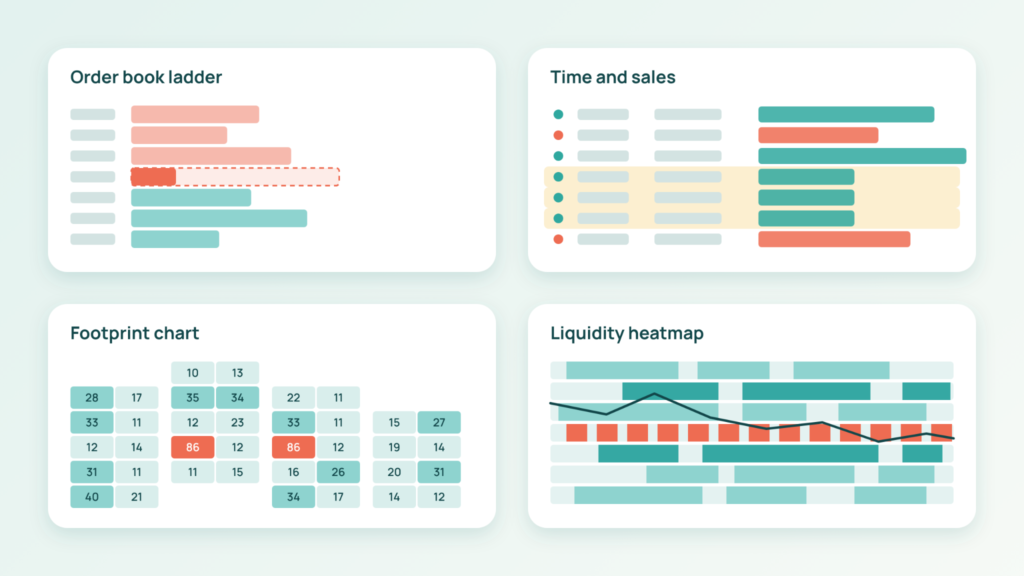 A heatmap and a footprint chart answer different questions. The heatmap shows what was on offer before trades happened, and the footprint reflects what changed hands. An iceberg sits in the gap between the two, so comparing them tells you more than reading either alone.
Some of this can be automated. Volume-based smart trading indicators can flag unusual size at a level, though they are better as a second opinion next to the tape than as a replacement for it. A flag alone cannot say whether the size is real or about to vanish.
Native Icebergs and Algorithmic Slicing in Crypto
Not every hidden order is a native iceberg, and the difference changes how the pattern looks on screen.
Researchers studying iceberg detection at the CME separate native icebergs, which the exchange manages, from synthetic ones, where a market participant submits each new slice. Crypto has both. Execution algorithms often randomize slice size and timing to avoid detection, so synthetic icebergs rarely show perfectly identical refills.
Hidden liquidity also extends beyond a single book. The same participant can split size across several exchanges and across spot and perpetual contracts, and large blocks may trade over the counter without touching a public book at all. A thin level on one venue can therefore be one piece of a much larger program.
A Simple Checklist for Confirming Hidden Size
A repeatable routine keeps interpretation honest. One workable sequence:
A heatmap and a footprint chart answer different questions. The heatmap shows what was on offer before trades happened, and the footprint reflects what changed hands. An iceberg sits in the gap between the two, so comparing them tells you more than reading either alone.
Some of this can be automated. Volume-based smart trading indicators can flag unusual size at a level, though they are better as a second opinion next to the tape than as a replacement for it. A flag alone cannot say whether the size is real or about to vanish.
Native Icebergs and Algorithmic Slicing in Crypto
Not every hidden order is a native iceberg, and the difference changes how the pattern looks on screen.
Researchers studying iceberg detection at the CME separate native icebergs, which the exchange manages, from synthetic ones, where a market participant submits each new slice. Crypto has both. Execution algorithms often randomize slice size and timing to avoid detection, so synthetic icebergs rarely show perfectly identical refills.
Hidden liquidity also extends beyond a single book. The same participant can split size across several exchanges and across spot and perpetual contracts, and large blocks may trade over the counter without touching a public book at all. A thin level on one venue can therefore be one piece of a much larger program.
A Simple Checklist for Confirming Hidden Size
A repeatable routine keeps interpretation honest. One workable sequence: - Mark the level where price stalled or turned.
- Compare the volume traded at that price with the largest size ever displayed there.
- Analyze the displayed quantity: did it refill after each hit, and how big were the refills?
- Watch the retest to see whether the price holds, stalls, or breaks through.
- Look at a second exchange or contract and see whether the same behavior shows up. Depth, spreads, and slippage vary by exchange. A thin book on a smaller venue might just reflect fewer users, with no hidden strength behind it. The criteria for choosing a regulated crypto exchange include real trading costs, not only the headline fee, and the same cost-first thinking helps when you compare two books. What This Analysis Cannot Tell You Hidden size is always an inference. A bid that has soaked up sellers for hours can disappear the moment the parent order is filled or pulled, and from outside the book, nobody can tell which happened. Even a well-supported read stays a probability, which is why position size and stop placement still matter. Test every finding against what price does next.