Summary
Routers show all your connected devices, but don’t necessarily tell you what they are doing. Your smart TV, phone, and other smart devices could be talking to the internet far more than you expect, and you don’t have easy visibility of this. I tried a free, open-source tool called ntopng that lets me watch what happens live, and it only took a few minutes to install it. Setup really is quick Install it, open a browser tab, and live traffic starts rolling in If you use Ubuntu or a Raspberry Pi running a supported Linux distribution, you can get ntopng running with just a few steps.
Start by running these two commands:
sudo apt update
sudo apt install ntopng
Wait for the installation to complete, then run this command and take note of the interface shown after “dev”: ip route get 1.1.1.1 .(In my test, it was wlo1, the Wi-Fi interface I wanted to monitor). - Run this command sudo nano /etc/ntopng/ntopng.conf , then add the Wi-Fi interface you identified. In my case, I added this line -i=wlo1. - Optionally, you can set the port for ntopng. By default, it uses port 3000, but this was already occupied in my setup, so I added two lines—one for HTTP and the other for HTTPS—to the same /etc/ntopng/ntopng.conf to change the port it uses (-w=3013 and -W=3014).
Save the changes (Ctrl+O > Enter > Ctrl+X) and run this command to restart the service: sudo systemctl restart ntopng . - Launch a browser and navigate to http://localhost:3000, replacing 3000 if you configured a different HTTP port.
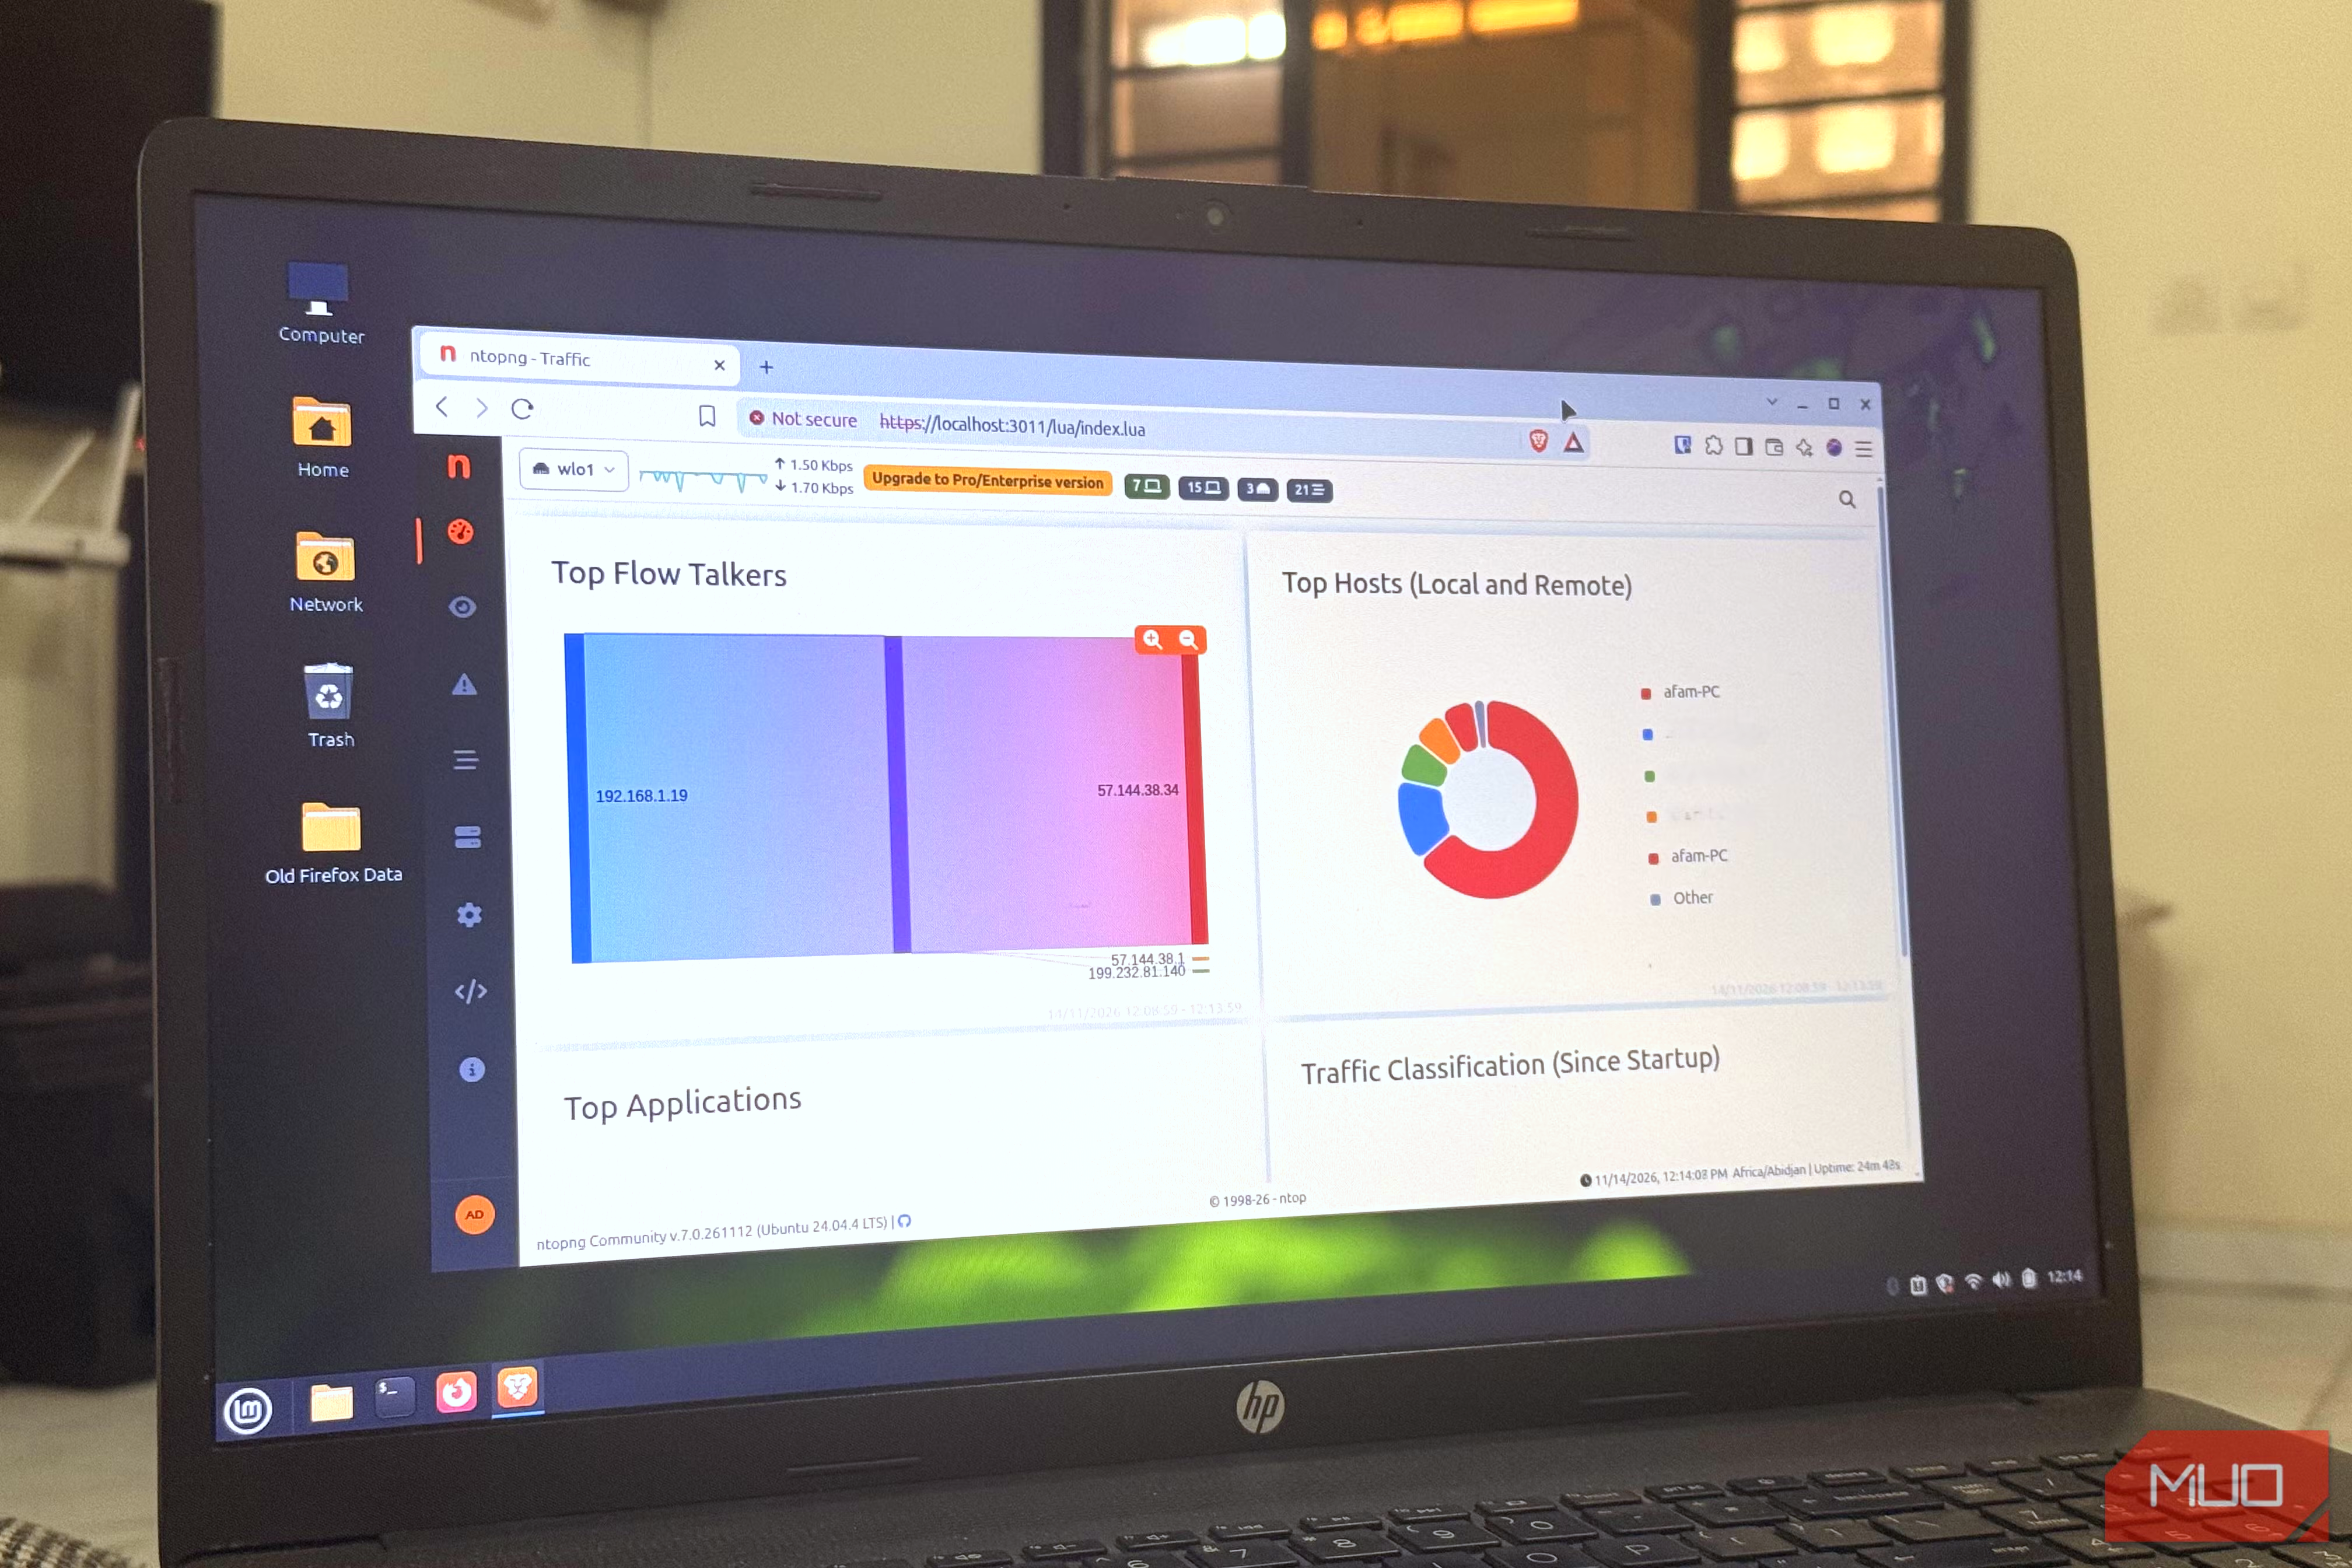
- Use admin / admin as the username and password for the first login, after which ntopng asks you to choose a new password. The dashboard immediately starts filling in. After nine minutes, my ntopng setup had a Top Flow Talkers chart and a Top Applications breakdown listing TLS, DNS, Facebook, and Tailscale. Many connections had an app name when I opened Live Flows. On the Hosts page, I saw the devices ntopng had detected, and the MAC List showed the manufacturers for some of them. However, your first view is narrower than it looks. Idle devices aren’t idle What your TV and smart devices get up to at 3 a.m. I looked at the dashboard at night when I knew no one was using anything. Sorting the host list by traffic revealed which supposedly sleeping devices aren’t actually sleeping. It brought these devices to the top of the list. The “LG webOS TV” entry stood out for me. It reappeared on the host list several times over one hour, briefly connecting to Amazon and other cloud services even though I wasn’t watching it. The rhythm of supposedly sleeping devices often gives them away, and ntopng made this visible. Nearly all traffic is encrypted, so ntopng doesn’t show what the exact communication is, but it reveals who the device is talking to. I started understanding the patterns the more I observed the traffic. | What you see | What it often means | When to investigate | |---|---|---| | Servers in other countries | Big companies’ data centers | The company behind the address is one you can’t place | | Unknown device | A phone, often on a private Wi-Fi address, or a smart plug | You can’t match it to anything you own | | Constant small connections | Normal phoning home | It never stops, or one quiet device moves far more data than similar ones | In the Live Flows window, there’s a column that names the company behind each address. In my case, I saw Amazon, Facebook, Fastly, and a few others. However, this tool isn’t just great for curiosity. I’ve found it handy for practical daily needs, like finding whatever is taking up upload bandwidth or checking what a “privacy-friendly” gadget really does. The one catch with ntopng Seeing the whole house takes one extra step By default, ntopng will see traffic that passes through its host machine. So installing it on a laptop mostly shows you what happens on the laptop. However, you catch a lot of shouting as well. It’s similar to a guard stationed at a building’s entrance. It guards the house and sees or hears what people outside may be saying. From the host machine, it captured my LG TV, and the MAC list showed its model. The traffic breakdown for several other devices showed “Sent 100%”, although I couldn’t see their full network activity from my laptop. The cleanest setup is to run ntopng on a firewall like OPNsense or pfSense, since that is where all your traffic passes through by default. However, you wouldn’t be able to run ntopng on most ISP-supplied routers. Another route is a managed switch with port mirroring, which copies traffic to a Pi. But generally, the installation is the quickest part of the process; it takes more effort to see every device’s traffic. Furthermore, I used ntopng’s free Community edition, which is built for small networks, like my home setup. This works great for flows and alerts, but you’ll need the paid tier for reporting and the extra security checks.