Summary
A media server is usually the first thing I want to build when I get my hands on some new hardware for my homelab. Plex, Kodi, or Jellyfin promise an immediate payoff because I can open an app and start watching my own media collection. Things like DNS logs, device inventories, and uptime graphs are, unfortunately, considerably less exciting. However, before filling up another disk with media, I created a fresh Ubuntu 26.04 virtual machine and asked myself what I should do to improve my network first. I installed five services that covered DNS, device discovery, availability, internet performance, and access to local dashboards — these services will improve every device and every self-hosted application I add afterward, including the media server. I gave one VM five different network jobs Each service solved a problem before the first movie started playing I spun up a modest Ubuntu Linux VM and assigned it an IP address of 192.168.1.126 , gave it 6GB of vRAM and a 20GB vDisk. The idea was to use this single server with Docker Compose deployed rather than creating a separate VM for every job:
AdGuard Homehandles DNS control, filtering, and the local DNS records I would need later on. - Uptime Kuma watches over my devices and internet connection for failures.
- NetAlertX scans the LAN and builds an inventory of connected devices.
- Speedtest Tracker periodically runs speed tests and logs results.
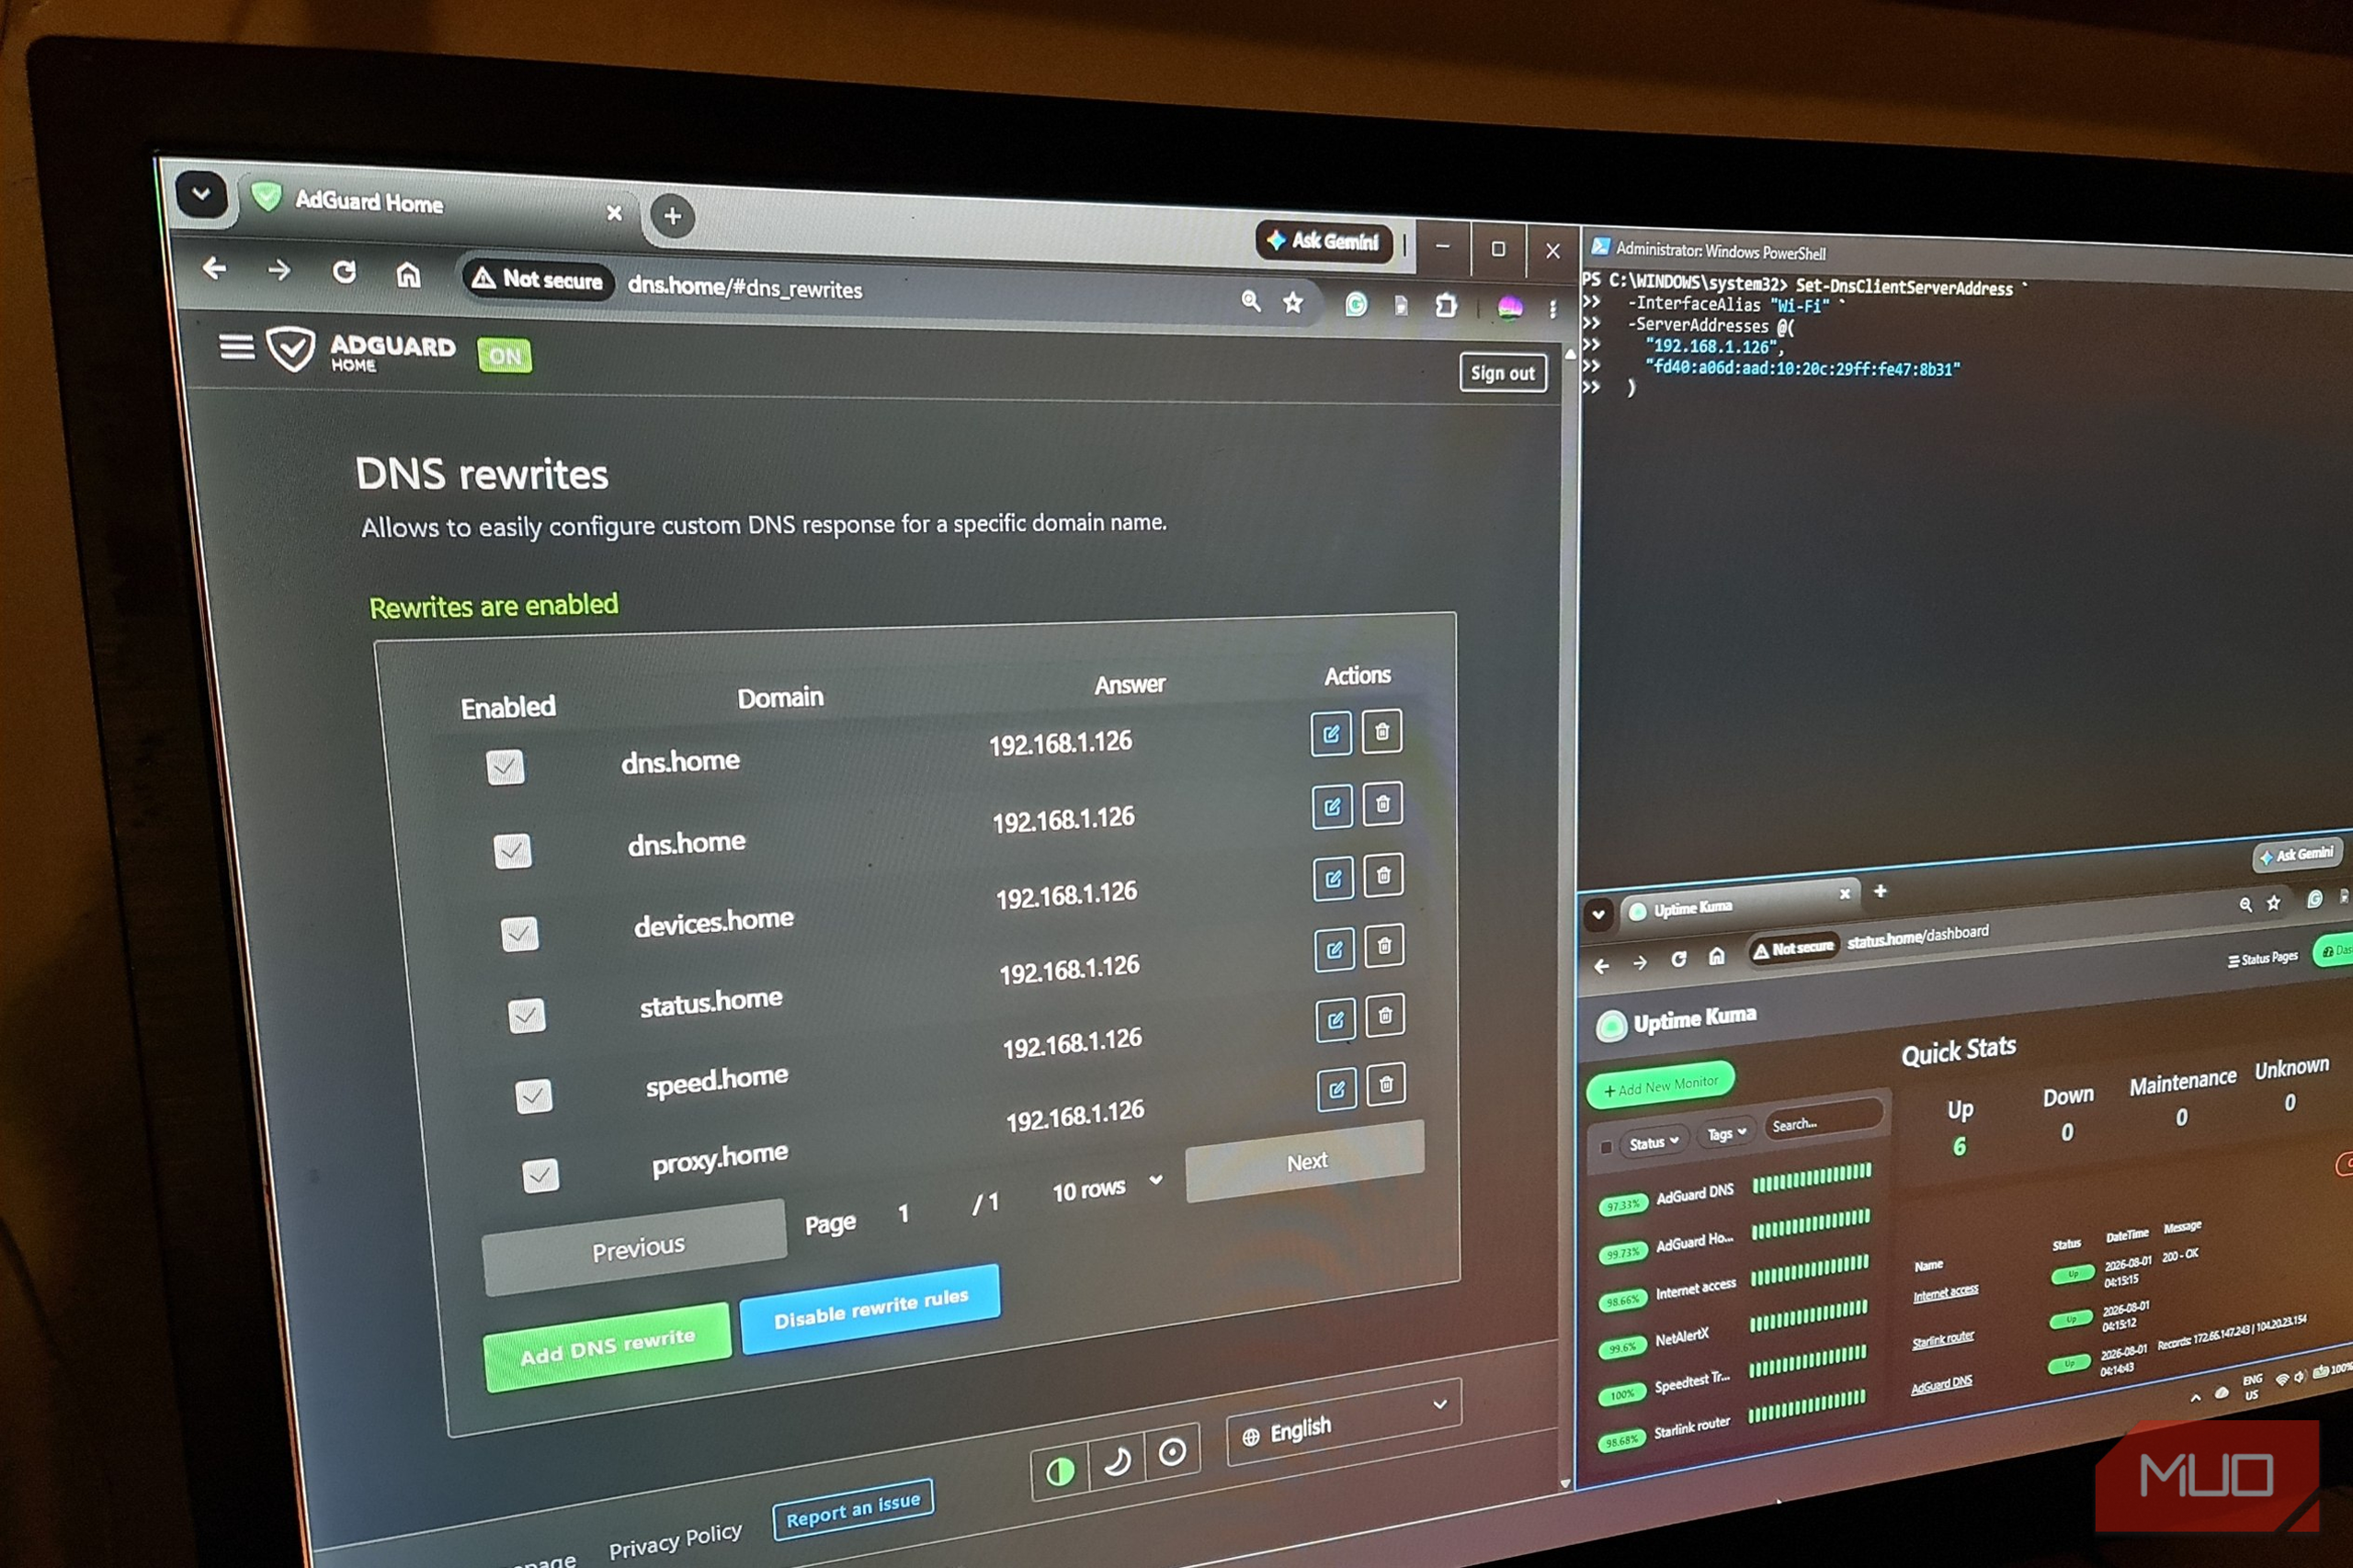
Nginx Proxy Manager replaces the 192.168.1.126 address and port numbers with readable local names. Only AdGuard Home and NetAlertX used host networking because they needed direct access to the VM’s network interfaces to work. The other containers shared a Docker network. All five fitted happily on the one VM, but each answered a different question and performed separate tasks. Together, they built a small network toolkit that enabled my new media server. AdGuard Home gave my entire network one DNS policy Ad filtering was useful, but the query log and local rewrites are why I picked it AdGuard Home is widely known as a network-wide ad blocker, a job it handles really well. I did add a controlled ads.test rule, queried it from my Windows laptop, and watched the request get blocked. As useful as that was, ad filtering isn’t the main reason I wanted it. I was more interested in using AdGuard as a network DNS control point for the network. The query log showed which device requested each domain, while named client entries replaced anonymous and boring addresses with useful labels like “Windows Laptop” and “NetworkOps Server.” Its DNS rewrite function also let me create local records such as dns.home, which became the naming foundation for every service I created on the VM:
- dns.home (AdGuard)
- devices.home (NetAlertX)
- status.home (Kuma Uptime)
- speed.home (Speedtest tracker)
- proxy.home (Nginx Proxy Manager)
Of course, this did mean I had created a central point of failure, which made the next service just as important.
If your network uses IPv6, configure AdGuard Home for both address families. Otherwise, your clients will query using your router’s IPv6 resolver and bypass lookups. Adding the AdGuard server’s ULA address as the IPv6 DNS server will fix this common issue.
 AdGuard DNS
 - Developer
- Adguard Software
- Plan Options
- Free Public/Licenses AdGuard DNS is a free, privacy-focused DNS service that blocks ads, trackers, and malicious websites across all your devices. No apps needed, just change your DNS settings.
- Services
- AdBlocking DNS
Uptime Kuma stopped every outage looking the same
A red monitor told me whether DNS, the router, or one container had failed
Uptime Kuma is a simple uptime monitor and is a far better solution for pinpointing points of failure than just assuming the entire network is down. I created five monitors that covered every service on the VM plus a ping to my Starlink Mini router and a DNS lookup through AdGuard Home.
Once I added each service, I received a dashboard full of green monitors that looked very reassuring. But I wanted proof that Kuma could actually recognize a failure, so I deliberately stopped the NetAlertX container:
docker compose stop netalertx
The monitor turned yellow, then red, and the event was logged in its history. After bringing the container back with docker compose start netalertx
, Kuma recovered the recovery, and the monitor turned green again.
Kuma still shares the VM with everything it watches. If the entire VM goes down, its monitor goes with it and can’t actually send a warning. While the host remains reachable, though, it can still distinguish a DNS failure from a router or container problem.
 Uptime Kuma
 - OS
- Linux, Windows, Docker
- Developer
- Louis Lam Uptime Kuma is a lightweight, self-hosted monitoring tool that tracks websites, servers, and network services, sending alerts whenever something goes offline.
- Price model
- Free, Open-source NetAlertX showed me what was actually connected The unfamiliar devices were not necessarily intruders Before installing NetAlertX, I had no reliable inventory of my network. The router’s client list just shows what’s connected at any given time, and usually under vague names that don’t mean much outside of an IP and MAC address. Because the VM reached the LAN through a bridged Ethernet adapter, I first needed to confirm that ARP discovery could see beyond the hypervisor: sudo arp-scan —interface=ens33 192.168.1.0/24 This returns a list of devices currently connected via the subnet: 192.168.1.1 74:24:x (Unknown) 192.168.1.83 66:27:x (Unknown: locally administered) 192.168.1.120 90:ca:x (Unknown) 192.168.1.134 de:cf:x (Unknown: locally administered) 192.168.1.245 14:13:x (Unknown) Knowing that ARP discovery was working, I then set NetAlertX’s SCAN_SUBNETS value to [‘192.168.1.0/24 —interface=ens33’] . It then built a persistent inventory that contained:
- IP addresses
- MAC addresses
- Manufacturers
- First and recent appearances
- Online and offline states
- New-device events As I understand it, NetAlertX isn’t an intrusion-detection or prevention system. An unfamiliar device can definitely give me something to investigate, but it doesn’t prove that someone unfriendly has entered the network. Its real value lies more in replacing a temporary client list with something that reads more like a history and log. NetAlertX is a self-hosted network discovery tool that inventories connected devices, records appearance and status changes, and alerts you when unfamiliar hardware appears.
- Developer
- Jokob
- Price model
- Free Speedtest Tracker gave isolated results some context My internet’s performance needed a timeline, not one flattering test The purpose of this service was to gain insight into what times of the day were more suitable for streaming and downloading media when I inevitably built the media server. A normal speed test is more like a snapshot in that it’s easy to remember the good results, and even easier to forget the bad ones. Speedtest Tracker replaces those occasional checks with one scheduled run every two hours. Each result retains download and upload speeds, ping, jitter, packet loss, ISP information, and the selected test server. My Compose configuration for this task kept both the schedule and test server consistent: SPEEDTEST_SCHEDULE: “17 */2 * * *” SPEEDTEST_SERVERS: “55297” The schedule ran at 17 minutes past every second hour, avoiding any obvious “top-of-the-hour” slots where destination servers typically get slammed. I pinned Superloop’s Melbourne server, ID 55297 , so a different Ookla destination could not distort any comparisons between runs. Speedtest Tracker is a self-hosted web app that schedules Ookla speed tests and charts download speed, upload speed, latency, jitter, and packet loss over time.
- Developer(s)
- Alex Justesen (and contributors)
- Price model
- Free and open-source Nginx Proxy Manager made the collection feel like one system Readable names finally replaced a growing list of ports By the time all four services were running, I had accumulated quite a collection of assigned service ports:
- http://192.168.1.126:3000 (AdGuard)
- http://192.168.1.126:3001 (Uptime Kuma)
- http://192.168.1.126:20211 (NetAlertX)
- http://192.168.1.126:8080 (Speedtest Tracker)
It was getting obvious that remembering which port opened which service was going to get pretty tedious, fast.
The AdGuard DNS rewrites from earlier all resolved readable names to the VM’s IP address. I needed Nginx Proxy Manager to read the requested hostnames and then forward the browser to the matching service.
In Nginx Proxy Manager, I created one Proxy Host for each local name. Every entry used is just plain HTTP, its .home domain, and the hostname or address and port of the service behind it.
AdGuard Home and NetAlertX used 192.168.1.126
with ports 3000
and 20211
because their containers both share the host’s network. Uptime Kuma and Speedtest Tracker used uptime-kuma:3001
and speedtest-tracker:80
because they both shared the same network Nginx Proxy Manager was on.
Once I saved those entries, every request still arrived at the same VM, but Nginx Proxy Manager used the requested domain to send off the requests to the correct dashboard.
 Nginx Proxy Manager
 - OS
- Linux, macOS
- Price model
- Free Nginx is a popular, open-source software used as a web server, reverse proxy, load balancer, and HTTP cache. I built the useful part before the entertaining part Every future service now has a better foundation Running five services creates more DIY tax in the form of updates and maintenance than installing one media server. Keeping them all together also makes the VM a big central point of failure. If the host goes offline, all the DNS, monitoring, device discovery, and performance tracking disappear along with it. That’s a genuine downside, and believe me, it’s nowhere near as satisfying as opening a movie library on my brand new media server. Still, each service has its place. I now have network-wide DNS filtering, a device inventory at close hand, records of service outages, and readable addresses for not only these network services, but my new media server too. When I eventually get around to setting up my media server, I can give it a local name, add it to the Uptime monitor, and keep a close eye on the best times to stream and download. I also won’t be needing to bolt on some last-second infrastructure after something stops working. The movie library can wait just a little longer. At least now I will know which part of my network is stopping everything from loading.