Summary
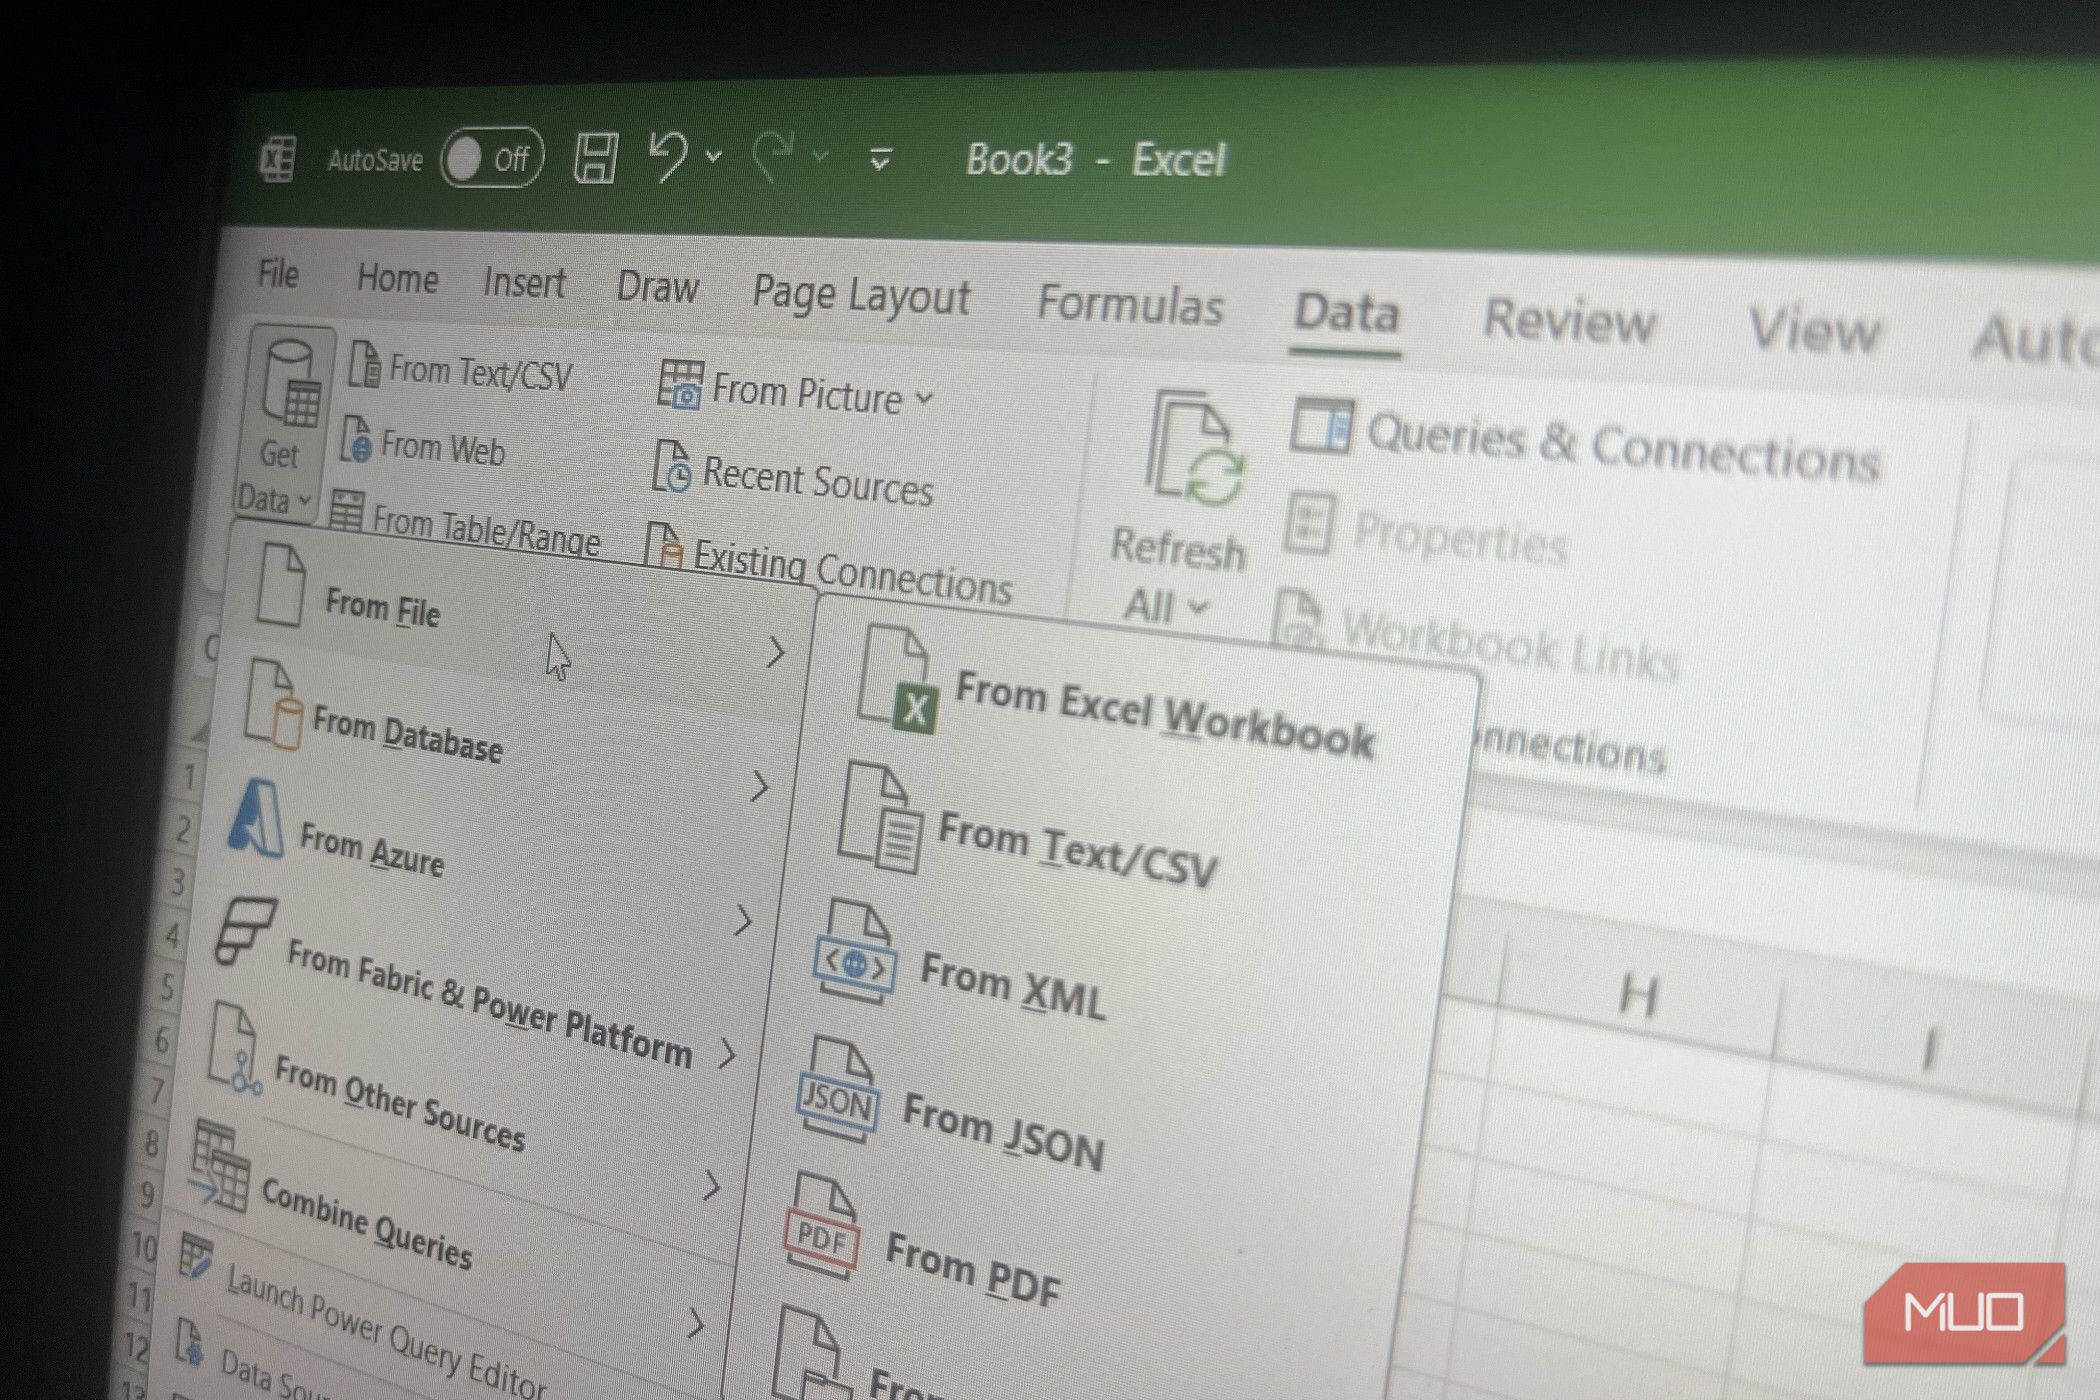
My work used to involve waiting for raw files, opening them one by one, copying the data, pasting it into a master sheet, fixing column names and formats, removing junk rows, combining all the necessary files, applying formulas, and refreshing charts. I did this every month for three years, without fail, to build the report we needed for our monthly review meeting. If you’re in a fairly large organization, that could mean combining 114 files from 19 locations, with three units of measure and different product levels. That was my situation until Excel’s Power Query feature saved me. Breaking the copy-paste cycle If you’re still combining files manually every month, there’s a better way I didn’t learn about Power Query because I was looking for a way to automate my reports. I simply stumbled upon the Get Data button under the Data tab. Out of curiosity, I started playing with it, and that’s how I began using Power Query. The Power Query Editor is my favorite aspect of the tool. It acts like a recording studio for your data transformations, tracking everything you do, from removing columns and filtering rows to merging tables and changing data types, and saving each action as a sequence in the Applied Steps pane. This means you can perform a transformation once, and Power Query remembers it so you can apply it again. When you’re ready to run those steps on new data, you just click Refresh All. Most importantly, you don’t have to know how to code to use Power Query because it generates the M code for you in the background while you apply steps. If you’d rather write the script yourself, however, the Advanced Editor lets you modify the code and create more customized automations. Power Query has many useful features, but I’ve found three to be particularly useful. The Unpivot Columns feature takes a wide, human-readable table, where weeks or months appear as columns, and collapses it into a clean, database-friendly list of rows in seconds. I also love the From Folder option under Get Data because you can point Power Query to a single SharePoint or local folder, drop 50+ Excel files or 100 monthly CSVs into it, and have Power Query automatically ingest, clean, and append them into one consolidated table. Another feature I find useful is Power Query’s advanced data merging, which lets you combine disparate data sources, such as Excel sheets, CSVs, and SQL databases, without bogging down the workbook with millions of fragile formulas. Since you don’t need massive, memory-heavy formulas, your files can also become smaller. After learning about these features, I couldn’t keep copy-pasting my sheets every month just to produce one updated record. From multiple files to one refreshable report Set it up once, drop in the new files, and let Excel handle the repetitive work After learning more about the Get Data button in the Get & Transform Data group on Excel’s Data tab, I clicked it and selected From File > From Folder. I then selected the exact folder path where I store my monthly report files and clicked Combine & Transform Data. This prompts Power Query to read all the files in that dedicated folder, allowing you to filter, expand, and consolidate them automatically. For the cleanest import, make sure all the files you drop into this folder have the same structure and identical column headers. Once connected, the Power Query Editor window will launch. This is your dedicated workspace for cleaning and shaping your data. Power Query never alters your source files; it only reshapes your view of the data. Every cleanup action you perform, such as deleting unnecessary columns, promoting headers, or changing data types, is automatically recorded as a distinct, labeled step. You can view, edit, or reorder these actions at any time in the Applied Steps section of the Query Settings pane. Since my raw files have a wide layout, with individual columns representing separate weeks or months, I needed to normalize them. I selected the stable column (such as the Name column) I wanted to keep, right-clicked, and selected Unpivot Other Columns. Power Query instantly collapses those horizontal columns into clean, vertical rows. This transforms your wide table into a standardized, database-friendly layout that works well for pivot tables and formulas. When your data is fully transformed and unpivoted, navigate to the Home tab in the Editor and click Close & Load. This loads your finalized data into your Excel workbook as a structured table, by default, or directly into Excel’s relational Data Model, if you’d prefer that. The beauty of this automated system is that when a new month of data arrives, you don’t have to repeat any of the manual work. Simply drop the new raw file into your designated folder, open your master workbook, and click Refresh All on the Data tab. Power Query will execute the M code in the background and repeat every step of your workflow, from reading the new file and applying your transformations to unpivoting the columns and updating your final Excel report in seconds. Less time building reports, more time listening to your data When you automate report building in Excel, you can spend more time analyzing the data instead of preparing it. After stacking multiple files, I’ve been able to discover major operational bottlenecks faster and more seamlessly. For instance, I’ve found that close to 50% of late orders were concentrated in one region on a particular weekday, something that would have been much harder to spot when I was spending most of my time manually preparing the report. There’s also no harm in learning Power Query if you’re an administrator or HR professional. Learning how to work with data is one step closer to becoming a data scientist, and that’s never a bad skill to have.