Summary
I installed the Homarr dashboard on my homelab server to keep an eye on everything. However, in true homelab style, I built the dashboard, admired it, and then never looked at it again. This left an obvious problem. A status page can’t really warn me about anything while it sits idle on the same server it’s meant to monitor. I’d also fallen behind the times a bit when it comes to visual automation tools because I’m more comfortable writing scripts than arranging a visual workflow. After looking at both Make and n8n, I chose n8n because its fair-code software could run on my own hardware. I installed it on a separate mini PC and taught it to check six services, retry failures, send Telegram alerts, and deliver a daily health report. I put the watchdog outside the server it watches The monitor needed to survive the failures it was supposed to report My Home Ops server was already the best candidate to test as a monitoring target. It’s an Ubuntu VM with access to the LAN via an adapter with the IP address 192.168.1.153 . Currently, it hosts nine containers:
- Homarr dashboard
- Uptime Kuma
Portainer - Glances
- File Browser
- Dozzle
- IT-Tools
- UPS battery monitoring
- Connector to a hobby radio project I didn’t really want the homelab watchdog hosted on the same VM. If it froze or the Docker stack failed, putting the alarm inside it would just make everything crash spectacularly together. So, I installed n8n alongside ntfy on a separate mini PC that’s already running services, independent of the Home Ops server on 192.168.1.249 . I pinned n8n to version 2.38.6 rather than using latest . I mapped its data directory onto the host so workflows and credentials would continue existing if the container had to be replaced: Services: n8n: image: docker.n8n.io/n8nio/n8n:2.38.6 restart: unless-stopped ports:
- “127.0.0.1:5678:5678” volumes:
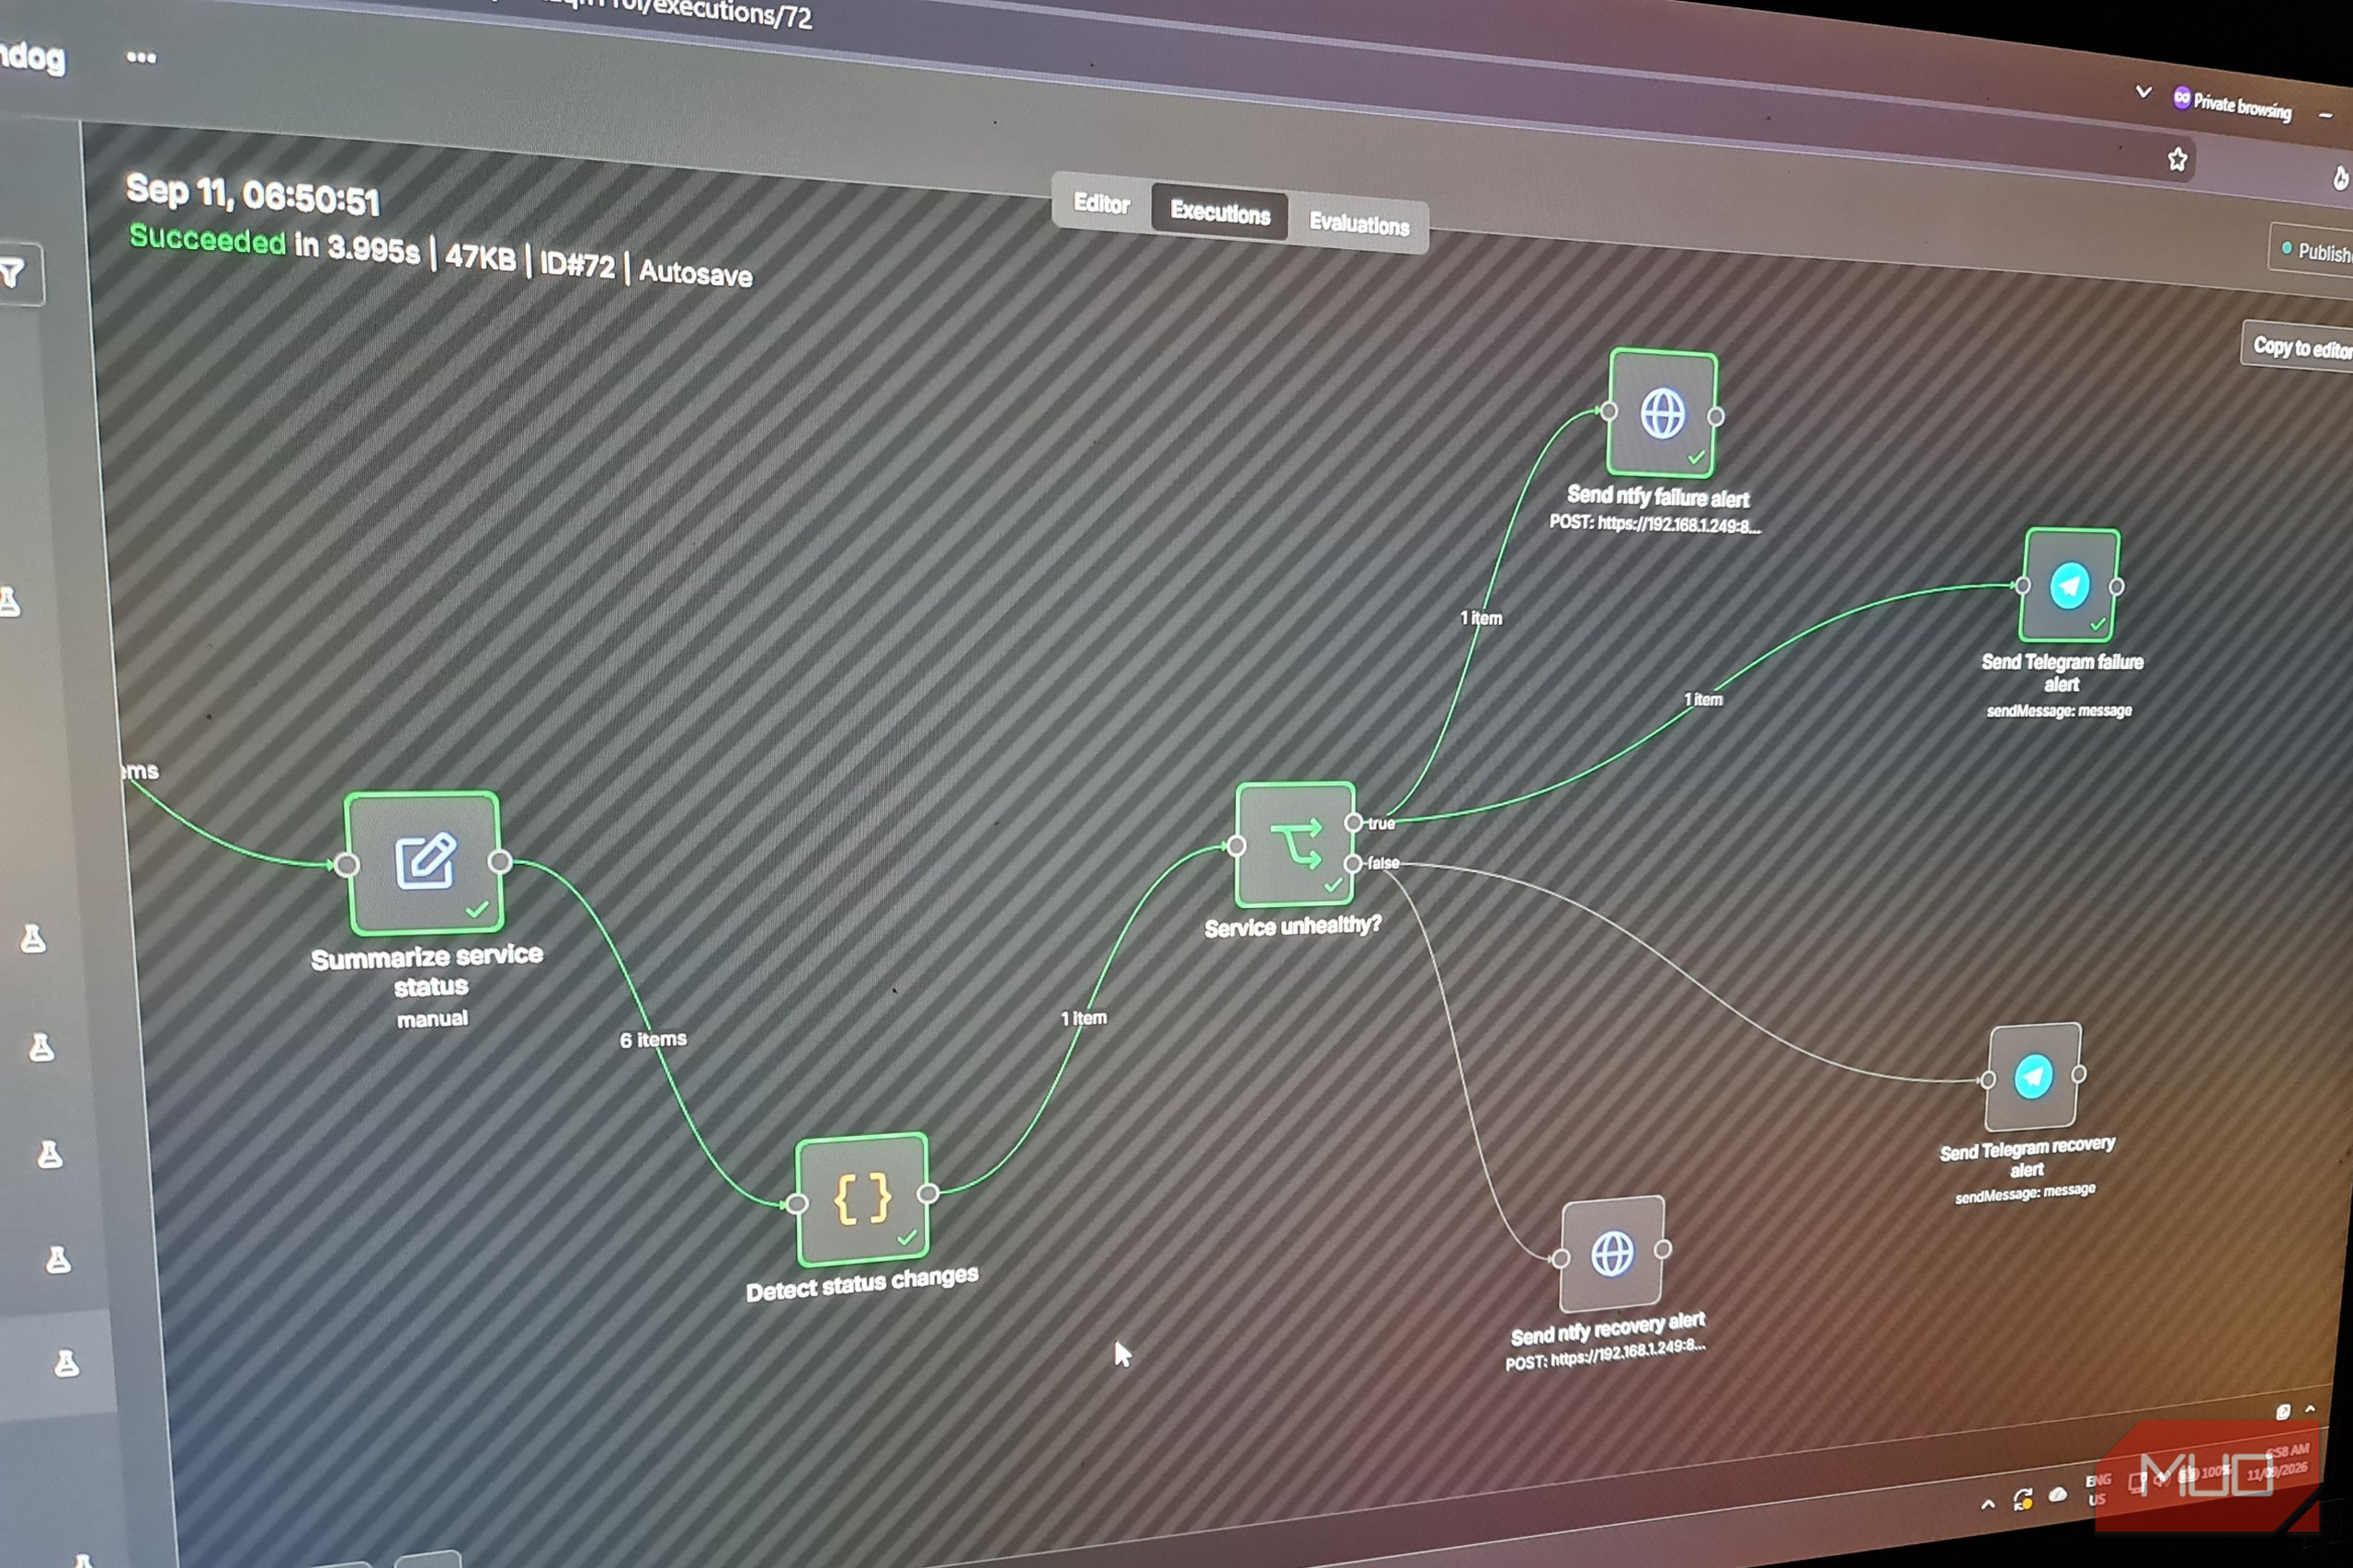
- ./data:/home/node/.n8n I bound port 5678 to localhost, so it wasn’t directly exposed to the LAN. Caddy handled all the browser-facing connections, serving n8n through internal HTTPS on port 8449 . The monitor was now separate, persistent, and reachable. The workflow checks everything but only speaks when something changes Five-minute monitoring would be unbearable without retries and memory I started the automation off with a Schedule Trigger that runs every five minutes. Its first Code node creates six items, each containing a service name and the URL n8n requests. Keeping this in one block made it much easier to add or remove services than duplicating the initial HTTP node for every application: return [ { json: { service: “Homarr”, url: “http://192.168.1.153:7575” } }, { json: { service: “Uptime Kuma”, url: “http://192.168.1.153:3001” } }, { json: { service: “Portainer”, url: “http://192.168.1.153:9000” } }, { json: { service: “File Browser”, url: “http://192.168.1.153:8081” } }, { json: { service: “IT-Tools”, url: “http://192.168.1.153:8082” } }, { json: { service: “Glances”, url: “http://192.168.1.153:61208” } } ]; n8n then passes those items through a single HTTP Request node. I gave each request the following:
- Five-second timeout.
- Two retries.
- Redirect following.
- Never Error option.
The Never Error setting is there because an unavailable service needed to become data the workflow could still evaluate, and not an error that stopped the execution in its tracks.
Because the output from this request was a huge mess of HTML, an Edit Fields node was then used to strip each result down to a service name, URL, status, and isHealthy Boolean. For this, I treated responses from 200 through to 399 as “healthy”, which also allowed Uptime Kuma’s redirect to pass through. A refused connection became status 0
rather than halting the entire workflow.
The next Code node remembers each service’s previous state. It updates that state on every scheduled execution, but only emits an item when up
changed to down
, or vice versa:
const state = input.all()) {
const currentState = item.json.healthy ? ‘up’ : ‘down’;
const previousState = state[item.json.service];
state[item.json.service] = currentState;
if (previousState ! undefined && previousState ! currentState) {
changes.push({
json: { …item.json, previousState, currentState }
});
}
}
return changes;
This is where I ran into some problems. My first wiring, designed to send a notification to a Telegram bot, was placed after ntfy. This meant that it received ntfy’s API response instead of the service record.
The resulting notification then confidently announced that “undefined is DOWN.” Reconnecting both channels in parallel fixed the issue and was a useful lesson in how line visual automation works.
 n8n
n8n - Platform(s)
- Browser-based. Available through managed n8n Cloud or self-hosted using Docker, npm, or a server installation
- Developer
- n8n GmbH, Berlin, Germany n8n is a flexible, open-source workflow automation platform that lets you visually connect apps, APIs, and AI models to build powerful multi-step automations with or without code
- Price model
- Free self-hosted Community edition Breaking my own services proved the alerts were working The silence after the first warning was part of the test My Home Ops containers were stubborn and continued to run happily. So, to test the automation, I had to deliberately break something. I stopped Homarr and left n8n to discover the outage during its next scheduled production run. docker stop homarr The resulting item still contained the service name and URL, but its status was 0 and healthy was false . That meant the connection had failed, not just a returned unfriendly HTTP page. Once this was established by the automation workflow, one urgent warning arrived through my self-hosted ntfy server and another through my private Telegram bot. I left Homarr stopped for another five-minute cycle. No further warnings arrived because the workflow remembered the down status. Without this functionality, a single failed container could fill both ntfy and Telegram with annoying repeated warnings until it was resolved. I then restarted Homarr and waited until curl confirmed HTTP 200: docker start homarr curl -sS -L -o /dev/null -w ‘HTTP %{http_code}\n’ http://192.168.1.153:7575 The next scheduled execution detected the change back to up and sent a single recovery message to both ntfy and Telegram. When repeating the test with the File Browser and IT-Tools containers, with the same outage, recovery sequence, and resulting alerts. My morning report became more useful than another dashboard Glances supplied the data, while n8n turned it into something readable The outage automation workflow has solved the issue of notifications for immediate failures, but I still wanted a quick overview each day to see the status of the server and the containers. I built a second workflow to run at 8:00 AM every morning, using the time zone already configured in n8n. Two HTTPS Request nodes queried Glances at /api/4/mem and /api/4/containers. A Code node then condensed the replies into a message that contained:
- Expected container counts.
- Memory use.
- Available memory.
- Any service that was flagged as needing attention.
With everything already running, the result was, of course, reassuring and boring. Nine of the containers were available, 32% of memory used, 2.6 GiB still available, and nothing requiring any attention. n8n sent the same readable summary through both ntfy and Telegram, which was much easier to glance at than opening Homarr at the breakfast table.
The container count needed one minor correction. Glances omitted a stopped container rather than returning it with a stopped status. Counting the response alone could therefore turn a real failure into an unassuming eight out of eight, rather than eight out of nine.
So, I added a fixed list of the nine containers I expected and compared the API response with it:
const reportLines = [
‘Home Ops daily report’,
”,
Containers available: ${availableNames.length}/${expectedContainerNames.length},Memory used: ${memory.percent}%,Memory available: ${availableGiB.toFixed(1)} GiB, problemNames.length ?Needs attention: ${problemNames.join(', ')}: ‘Needs attention: none’ ]; Stopping IT-Tools proved the change worked. The next report showed eight of nine and named IT-Tools under “Needs attention.” After restarting it, the clean nine-of-nine report had returned. Uptime Kuma is easier, but n8n gives me somewhere to go next The alerts work today, and the workflow could eventually try to fix the problem itself Uptime Kuma will always be my first recommendation for monitoring software. Give it a URL and interval, then just let it do its thing. n8n was more complicated. To get the same functionality I needed: - Docker.
- Credentials.
- Response cleanup.
- State tracking.
- Careful wiring. Mistakes are also easy to make, as evidenced by the connection problem I caused by having the Telegram notification nodes after ntfy. Separating it from my Home Ops server did remove the blind spot, but there are still others. If the mini PC, router, or I make a network mistake, both workflows will go silent. The big difference is that while Uptime Kuma tells me whether a target responds, n8n actually gives me somewhere to go next. Mine currently retries requests, suppresses duplicates, recognizes recoveries, sends through two notification channels, and builds a morning report. But that’s only the start. n8n’s SSH node can execute commands on a remote machine, so a later version could easily attempt one controlled docker restart , check URLs again, and report if the mitigation attempt was successful or not. The room to grow and experiment more is why I’d keep n8n above Uptime Kuma as the automation layer. Today my homelab reports real-time failures, but tomorrow it could attempt the first repair before I even get a notification.