Summary
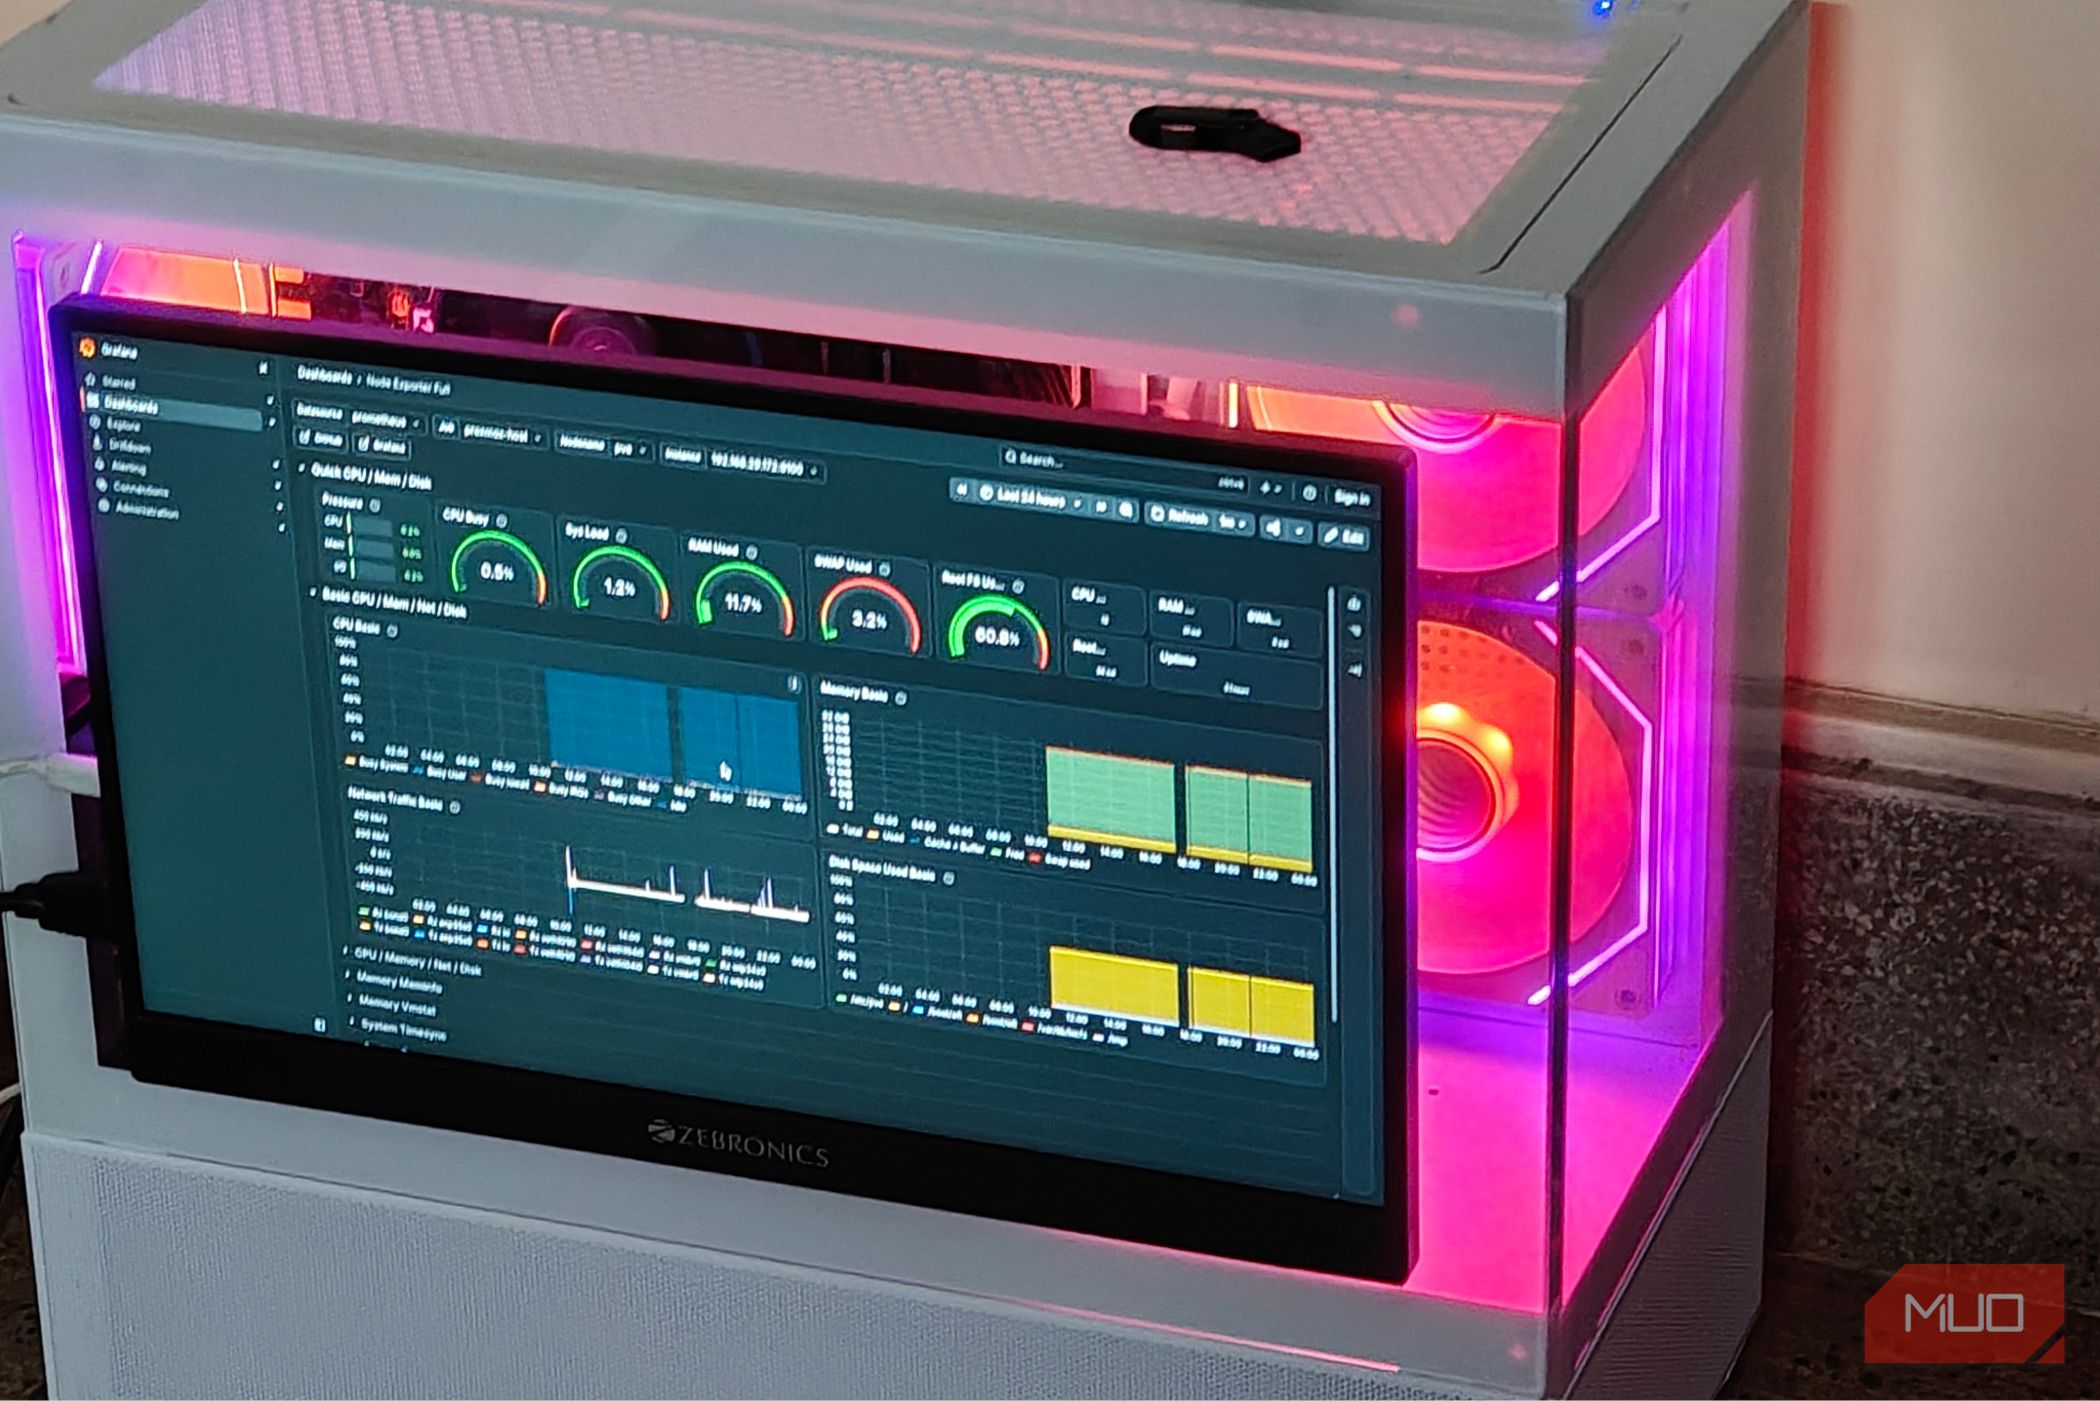
I’ve been having a lot of fun with Promox, and finally decided to take the plunge, transforming my existing gaming PC into a home server. It’s been a wild ride, but I’ve always felt that something was missing whenever I tried looking out to the other side of the room. The answer was an obvious one — another display! A live dashboard displaying stats is what I wanted to go for, and my best option turned out to be a portable monitor, attached to the sides of the case. It’s been quite transformative, and even had the added bonus of being a fallback display in case things went awfully wrong. A portable, USB-C powered monitor as the “kiosk” Stuck to the sides with double-sided tape I needed something small enough to fit onto the side of the case, and transform into a “kiosk” of sorts. Traditional monitors were out of the question; there is simply no way to mount something as large or heavy on the sides of the glass panel. Not to mention, they needed to be connected to another wall outlet to function in the first place. And so I turned my attention toward USB-C monitors. There are a variety of these monitors you can find on sites like Amazon, and I opted to pick the cheapest one I could find. My requirements were simple — USB-C power and a physical HDMI port, both of which were ensured by this rather basic, 250 nit 1080p IPS panel. I’ll be honest, it’s not particularly exciting, but it does get the basics right, and runs off USB-C power, needing only 12 watts to function. For $63, I’m not really going to complain. All that was left was the mounting and the wiring. For the wiring, I simply connected a standard USB-A to USB-C cable from one of the USB 2.0 ports of the motherboard, and it seemed to do the trick. As for the display out, I used the provided mini-HDMI (the display doesn’t use a full-size HDMI port) to HDMI cable. This was connected to the iGPU’s display out from the motherboard. With that sorted, it was time to mount the display. There was no way I was going to risk modifying the glass case, so I opted for the next best solution: sticky tape. This might roll some eyebrows, but hear me out. I used some “silicon grade” sticky tape to lay out three stripes on the glass panel, and carefully attached the USB-C display to it. It seems to be holding well, with no dislocation or stray movements so far. With the monitor set up and ready, it was time to boot into the server. Lo and behold, it worked just fine, and I was able to enter the Proxmox console without any hitches, with the display working. Installing the requisite packages in Proxmox Grafana and Prometheus LXC containers do the heavy lifting In its current state, the display is quite useless. It just displays a tty output, and nothing else. Of course, I could always log in and run something like bpytop, but that is nowhere as convenient, and defeats the purpose of an automated setup. I needed a graphical environment, or at the very least a fullscreen browser window to display some metrics. I chose the latter approach, since I don’t see a point in installing a full desktop session on a Proxmox server. I had to leverage Cage (a Wayland compositor) and Chromium (which seems to be everywhere) for this. Essentially, it opens up a nested, fullscreen session of Chromium that auto logins to a URL pointing at Prometheus. Prometheus is a monitoring system for Proxmox, and lets users collect live system data. This can then be fed to something like Grafana, which displays a custom “dashboard”. Installing both Prometheus and Grafana was dead simple using the community’s Proxmox VE script collection. Two commands in the terminal later, and I was off to configure the LXC container services to actually work together, which took far longer than it should have. Scripting Proxmox to actually display the stats Auto-login, more containers and some additional tweaks The first thing to do was configure Grafana. After setting the necessary permissions, I had to “connect” Prometheus to the dashboard, choosing from one of the many community themes as my kiosk’s display dashboard. At this point, I could simply log into Grafana and have it display the Prometheus-assisted stats menu within a list. This was still far from intuitive, and I still needed to fix two more things. The first was autologin. I needed the monitor to automatically boot into the Grafana web UI and open up the stats display. This was achievable using a custom .profile file, under the home directory. As you’ll see, this is essentially a wrapper for the Cage session running Chromium, set to open to one specific IP address. The address has to be the URL pointing to the dashboard, and I just copied and pasted the link here. The second problem was a far more annoying one - permissions. By default, Grafana requires you to log into the server with a password. This was a major snag, breaking the whole automation process. Thankfully, this was also solvable: I just had to disable login and enable admin access by default. It might sound a tad bit unsafe, but I made sure to keep permissions as read-only for the Grafana container. Finally, it was time to edit the tty1 service, and point it toward the kiosk profile, with autologin enabled. This would ensure that the server would always boot into the Chromium-Cage nested session, and autologin to Grafana’s dashboard. A quick sanity check and a reboot later, and it finally came together. Everything works, and I can also edit the Grafana theme to my liking, which is a plus. Useful as a fallback display There’s one other use case I came to accidentally find out during my process of inadvertently breaking the system. A portable monitor is a fantastic fallback display, and a quick way to check if anything goes wrong, in case of an unresponsive server. Thankfully, I’ve yet to encounter any catastrophic failures that warranted a switch to the portable display; but I can see it being useful in a pinch over time.