Summary
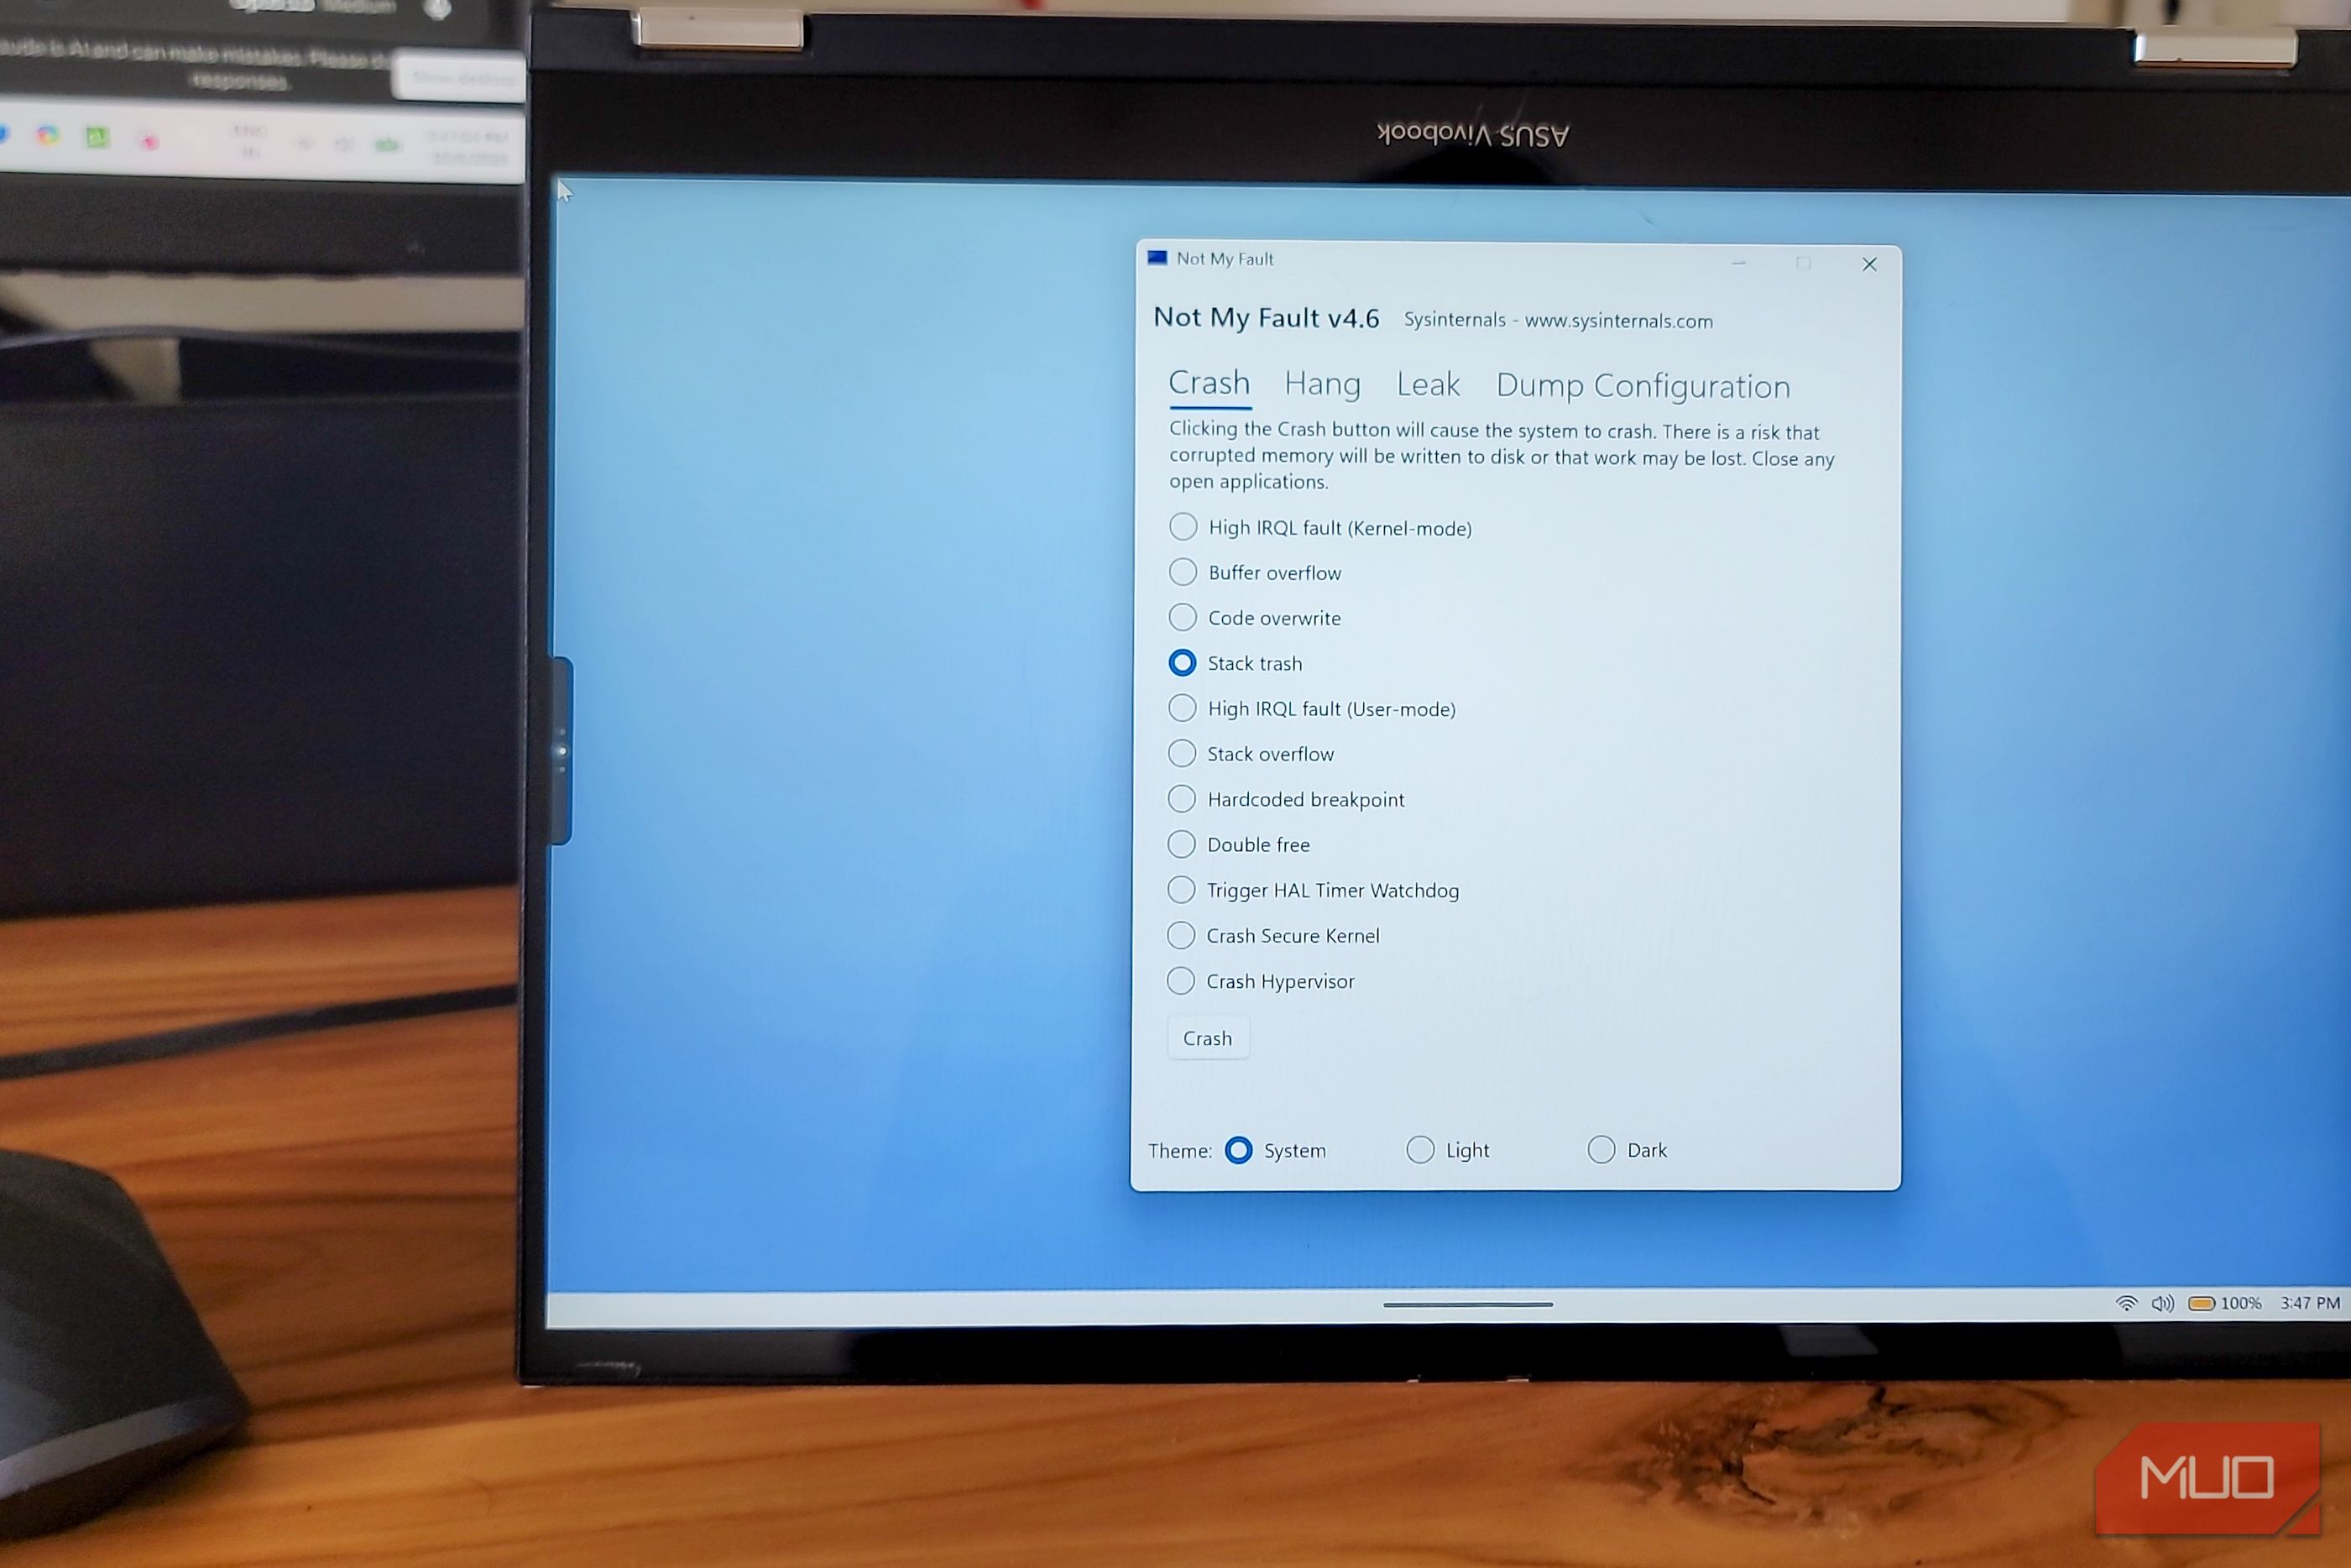
When a Windows PC crashes, it’s hard to tell what triggered it. Often, it’s a bad driver or newly installed hardware such as a new memory module or a USB device. However, if that’s not the case, the built-in Windows tools like Event Viewer and Reliability Monitor can be hit or miss. Sometimes they can tell what went wrong; other times they fail to catch the culprit. Surprisingly, the tool that can accurately tell you what caused the crash is a Microsoft tool, just not one that comes pre-installed on your PC. I crashed Windows on purpose three ways to find which of the built-in tools can explain it best, and WinDbg came out on top. Crashing the PC three times A throwaway VM and Microsoft’s own crash tool I ran everything inside a Windows 11 VirtualBox VM so no real hardware or data was at risk. The crash tool was NotMyFault, part of Microsoft’s Sysinternals suite of diagnostic utilities, designed to crash Windows on demand. You run it as admin, pick a crash type, and the system goes down instantly. I triggered three different crashes to see how each tool handled them. A High IRQL fault, the classic driver crash. A buffer overflow that corrupts memory. And a stack trash that breaks the call stack. Each one fails in a different way, which means a good diagnostic tool should catch them all. Before crashing, I set Windows to save small memory dumps and turned off automatic restart (System Properties > Advanced > Startup and Recovery) so each crash screen stayed on screen long enough to read. The buffer overflow didn’t crash on its own, so I enabled Driver Verifier’s Special Pool check for NotMyFault’s driver to force it. After each crash, I checked the same four places in the same order: the crash screen, Reliability Monitor, Event Viewer, and finally the dump file in WinDbg. Reading the crash results The built-in tools stopped at the stop code The crash screen was the first thing I saw after each crash, and the closest the built-in tools came to giving a real answer. On two of the three crashes (the High IRQL fault and the buffer overflow), it showed a What failed line right beneath the stop code, naming myfault.sys as the guilty driver. On the third crash, a stack corruption with stop code 0x139, it showed the stop code alone with no driver name. The catch is that Windows restarts automatically by default, so most people never get to read this screen. Nothing saves the information it shows once the restart happens. Next was Reliability Monitor, a tool I’ve relied on to diagnose PC slowdowns in the past, but it wasn’t of much help here. It recorded every crash, but split each one into three separate entries, which was confusing. When I clicked View technical details, all I got was the stop code, its four parameters, and the dump file’s name. No driver. No cause. Event Viewer told the same story. The Event 1001 (BugCheck) entry logged the stop code, parameters, and the dump path for each crash, but it was buried among generic Kernel-Power 41 and Event 6008 entries that only confirm the system shut down unexpectedly. You need to filter by Event ID to find the relevant log, and even then, it gives you the same limited information as Reliability Monitor. To be fair, these tools are not useless. They confirm that a crash happened, give you a stop code you can search online, and point to the dump file on disk. They never tell you why the crash happened. Every log I checked eventually pointed to the same place, which is the dump file. That was the only place the full answer lived. WinDbg is still the best way to read crash reports WinDbg named the guilty driver every time WinDbg named myfault.sys in all three crashes. On the 0x139 crash, where the crash screen and every other built-in tool came up empty, WinDbg was the only one to explain the cause. Its ERROR_CODE line described it as a stack-based buffer overrun, which is exactly what NotMyFault’s stack trash option does. That was the only plain-language explanation any tool gave across all three tests. I know it looks like a developer tool, and it is technically one. But the process of using it is simpler than it seems. You install WinDbg from the Microsoft Store or with winget, run it as admin, open the minidump file (stored in C:\Windows\Minidump by default), and run !analyze -v . Then look for three lines in the output: BUGCHECK_CODE tells you the stop code, IMAGE_NAME tells you which driver crashed, and ERROR_CODE explains the cause in plain language when available. In my tests, IMAGE_NAME showed myfault.sys every time. There are some honest caveats:
- WinDbg needs an internet connection the first time you open a dump because it downloads debugging symbols from Microsoft’s servers.
- The buffer overflow result also had help from Driver Verifier, which catches the corruption at its source, so that is a best-case scenario. In real-world crashes without Verifier running, memory corruption can surface later and blame the wrong driver entirely. But even with those limitations, WinDbg found the answer in every crash I threw at it, while the built-in tools stopped at the stop code every time. One last thing: make sure Windows is set to save small memory dumps. Go to System Properties > Advanced > Startup and Recovery > Settings and set the dump type to Small memory dump. Without a dump file, WinDbg has nothing to read. The best crash diagnostic is a file Windows already saves Often, crash codes are what I rely on to find the cause and fix of a crash. You search it, try a few generic fixes, and hope for the best. However, Windows writes the real answer to a dump file every time it goes down. The built-in tools I tested all knew a crash happened, but none of them could tell me which driver caused it. Keep small memory dumps turned on and WinDbg installed. The next time your PC crashes, you’ll know exactly what caused it.